
Statistics

Course objectives and method

During the course we will focus on different techniques used in statistics. We will provide the students with statistical skills and present a number of tools without focusing too much on the importance of the use and knowledge of these decision tools for managers. However, we will discuss the examples in the book through a critical eye and illustrate each chapter with some examples taken from real-life.
 
The textbook of Albright, Zappe & Winston takes a very practical approach and is strongly example-based. These examples are taken from a wide field of management, such as finance, marketing, operations management, human resources, etc… The book is based entirely on MS Excel (and an additional add-in). The add-in software tool is an excellent alternative for statistical software packages such as SAS, SPSS and many others.

Course material

Textbook: Albright, Zappe and Winston, “Data analysis, Optimization, and Simulation Modeling – 4th edition”, South-Western Cengage Learning, 2011
 
Software: Extensive use of MS Excel is made in both the textbook and the course. If the student has no basic knowledge of Excel, he/she can consult the tutorial provided by the coordinator. The additional software (Pallisade: StatTools add-in) is provided through the textbook.
 
Mathematical background: Some rookies asked me how they can update their knowledge in mathematics. I have therefore uploaded the slides and a text of an introduction class in mathematics that was given by a Vlerick collegue to rookies a couple of years ago. This collegue is Filip Goeman and he is always willing to help you with maths.

Downloads

Everytime the MS Excel symbol is displayed on the slides, an MS Excel file will be shown in class in order to constract a graph, analyze data, run a statististical test, etc. You can download the MS Excel files here.

Students who are not familiar with MS Excel (do they still exist?) can download a free tutorial written by Chris Albright here.

Notes

Upon request of some students, extra notes used in each session.

Session 1

Temperature: Formula for Farenheit and Celsius Conversions

  • C = 5/9 (F-32)
  • F = 9/5 C + 32
e.g.
 
C = 0 F = 30
C = 20 F = 68
C = 40 F = 104
 
Pivot tables: Experiments with Movie Stars.xls
 
Experiment 1. Are female actresses underpaid relative to male actors? YES
 
Row : Salary
Column : Gender
Body : Gender
 
→ Table is too long (difficult to draw conclusions)
→ Group: number of classes is now lower (easier to see)
→ Change to percentage of column
 
Experiment 2. Is it because female movies lead to gross less money than male movies? NO
 
Row : Domestic Gross
Column : Gender
Body : Salary
 
→ Display average salary
→ Group: number of classes is now lower (easier to see)
 

Session 2

Summary measures: Commands in MS Excel
 
Average : =average(data)
Median : =median(data)
Mode : =mode(data)
Minimum : =min(data)
Maximum : =max(data)
Quartile : =quartile(data,1 or 2 or 3 or 4)
Percentile : =percentile(data,0.35)
Variance : =varp(data) or var(data)
Standard deviation : =stdevp(data) or stdev(data)
Covariance : =covar(data1,data2)
Correlation : =correl(data1,data2)
 
MS Excel files:
  • The MS Excel file to illustrate that the covariance is affected by the units and the correlation is a unitless measure, can be downloaded here.
  • The MS Excel file to illustrate the rules-of-thums (sigma intervals) on the saraly database can be downloaded here.

Session 3

Homework: For one or another reason, the excel file of the homework P04_68.xls is not available on the website of the book, so you can download it here.

Exercise 4.11: The MS Excel file used to calculate the average and standard deviation for exercise 4.11 can be downloaded here.

The car/goat problem is also called the Monty Hall problem. On the following website, you see a simulation of this ‘game’. Press once, twice, three times, and continue, and you will see, switching is the best option! Go to http://www.decisionhelper.com/montyhall.htm?nstage=3&nswitch=1&nstay=0.

Session 4

Normal table: A normal table can be easily constructed using MS Excel. The empty table on page 25 of the slides can be filled using the simple “NORMDIST” function in Excel. Download the table here.

The rules-of-thumb (discussed in session 2 using a one, two and three sigma interval) can now be tested using MS Excel. As an example, assume a normal distribution with an average of 50 and a standard deviation of 3, then the following sigma intervals can be calculated:
  • One-sigma: =NORMDIST(53,50,3,1) - NORMDIST(47,50,3,1)
  • Two-sigma: =NORMDIST(56,50,3,1) - NORMDIST(44,50,3,1)
  • Three-sigma: =NORMDIST(59,50,3,1) - NORMDIST(41,50,3,1)
You will see that the three equations return 68.27%, 95.45% and 99.73%, respectively.
 

Session 5

Central Limit Theorem: Roll the dice and see that the central limit theorem is true. In class, I artificially illustrated this on the blackboard with 2 dice and 36 throws, but on the following website, you can do it with up to 5 dice and 10,000 throws. Go to http://www.amstat.org/publications/jse/v6n3/applets/clt.html

Session 6

Students t-distribution: The table used in class can be easily constructed and modified using MS Excel. Download the table here.

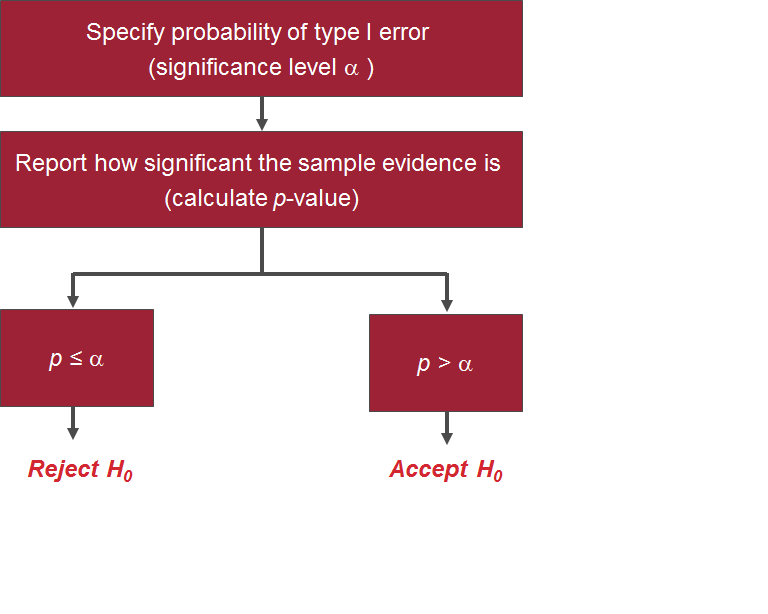
Confidence intervals and hypothesis testing are everywhere. Don’t go search the internet because you will be overwhelmed by sites and references. A very simple yet illustrative example is given at the following site: Go to http://www.unc.edu/~blopes/files/stat11spring03/Files/HypothesisTesting.pdf.

Apparently, one picture was not very clear on the slides, so you can download it here.

Session 7

Statistical Process Control: SPC is hot. Just search the internet, and you will find many sources on SPC. Currently, we are trying to transform SPC (Statistical Process Control) to SPC (Statistical Project Control). In other words, controlling and monitoring the performance of projects (building bridges, towers, IT projects, ...) using the principles borrowed from Statistical Process Control combined with Earned Value Management. Interested, follow us on our Twitter account, or visit EVM Europe.

Session 8

No extra downloads available. Good luck with the exam!